

YouTube View Ledger
I Built a Tool to Read a YouTube Channel's Vital Signs

How View Ledger started, what it does now, and the one bug that taught me the most
A small admission. I have spent more of my life than I want to count staring at someone else’s YouTube channel, scrolling, scrolling, scrolling, trying to answer one question. Is this person on the way up, on the way down, or just there. The platform itself will not tell you. It gives you total views, the subscriber count, and the warm fog of vibes. That is the whole dashboard.
So I made a tool.
It is called View Ledger. It is one HTML file. You open it, you paste a free Google API key, you type a channel, and a few seconds later you get a real read. Cadence. Reach. Engagement. Whether the thing is heating up or cooling down or just sitting there. Estimated revenue, if you want to play that game. The full catalog as a sortable table you can export. No login. No server. No tracking. It runs in your browser and goes home when you close the tab.
I made it for me. I am sharing it because I think it is useful, and because the journey of building it taught me something about honest analytics that I keep coming back to.
The Itch
I run Green Shoe Garage. I write here. I publish on YouTube. I watch other people’s channels. Some are friends. Some are competitors. Some are heroes. I want to know how they are doing. Not their bank balance. Their trajectory.
YouTube hides that on purpose. The analytics that would tell you live behind the owner’s login. The public API gives you lifetime totals, which is like trying to read a heartbeat from a photograph.
But there is a way. The Data API exposes every public upload’s individual stats. If you pull every video, you can compute the trends yourself. It is fiddly. It involves walking a playlist. It is exactly the kind of thing I love. So I started.
The First Version Was Wrong
The first version of View Ledger did the obvious thing. It pulled every video, divided views by days online to get a “views per day,” compared the newest videos to the oldest, and printed a verdict. Gaining momentum. Cooling off. Holding steady. It looked very confident.
It was lying.
The bug took me a while to see. A YouTube video gets most of its views in the first few weeks. After that, it tapers off and accumulates slowly forever. So an older video has a lower average-views-per-day than a newer one of identical popularity, just because the slow tail dragged its average down. The math I was doing made every channel look like it was heating up. The math was punishing time.
Worse. A channel that had not posted anything in three years still read as “Gaining momentum” if its old videos happened to be evergreen and kept slowly accumulating. There was no check for alive.
I had to throw the verdict out and start again. This is the part of the project I am proudest of.
What I Built Instead
The new verdict has two stages. First, an activity gate. The tool measures how often the channel posted historically, and how long ago the last upload was. If the silence is past about two and a half times the channel’s normal posting gap, with a six-month floor, the verdict reads Dormant and refuses to call a trend. Trends do not happen to corpses.
Then for live channels it does not look at one signal, it blends four.
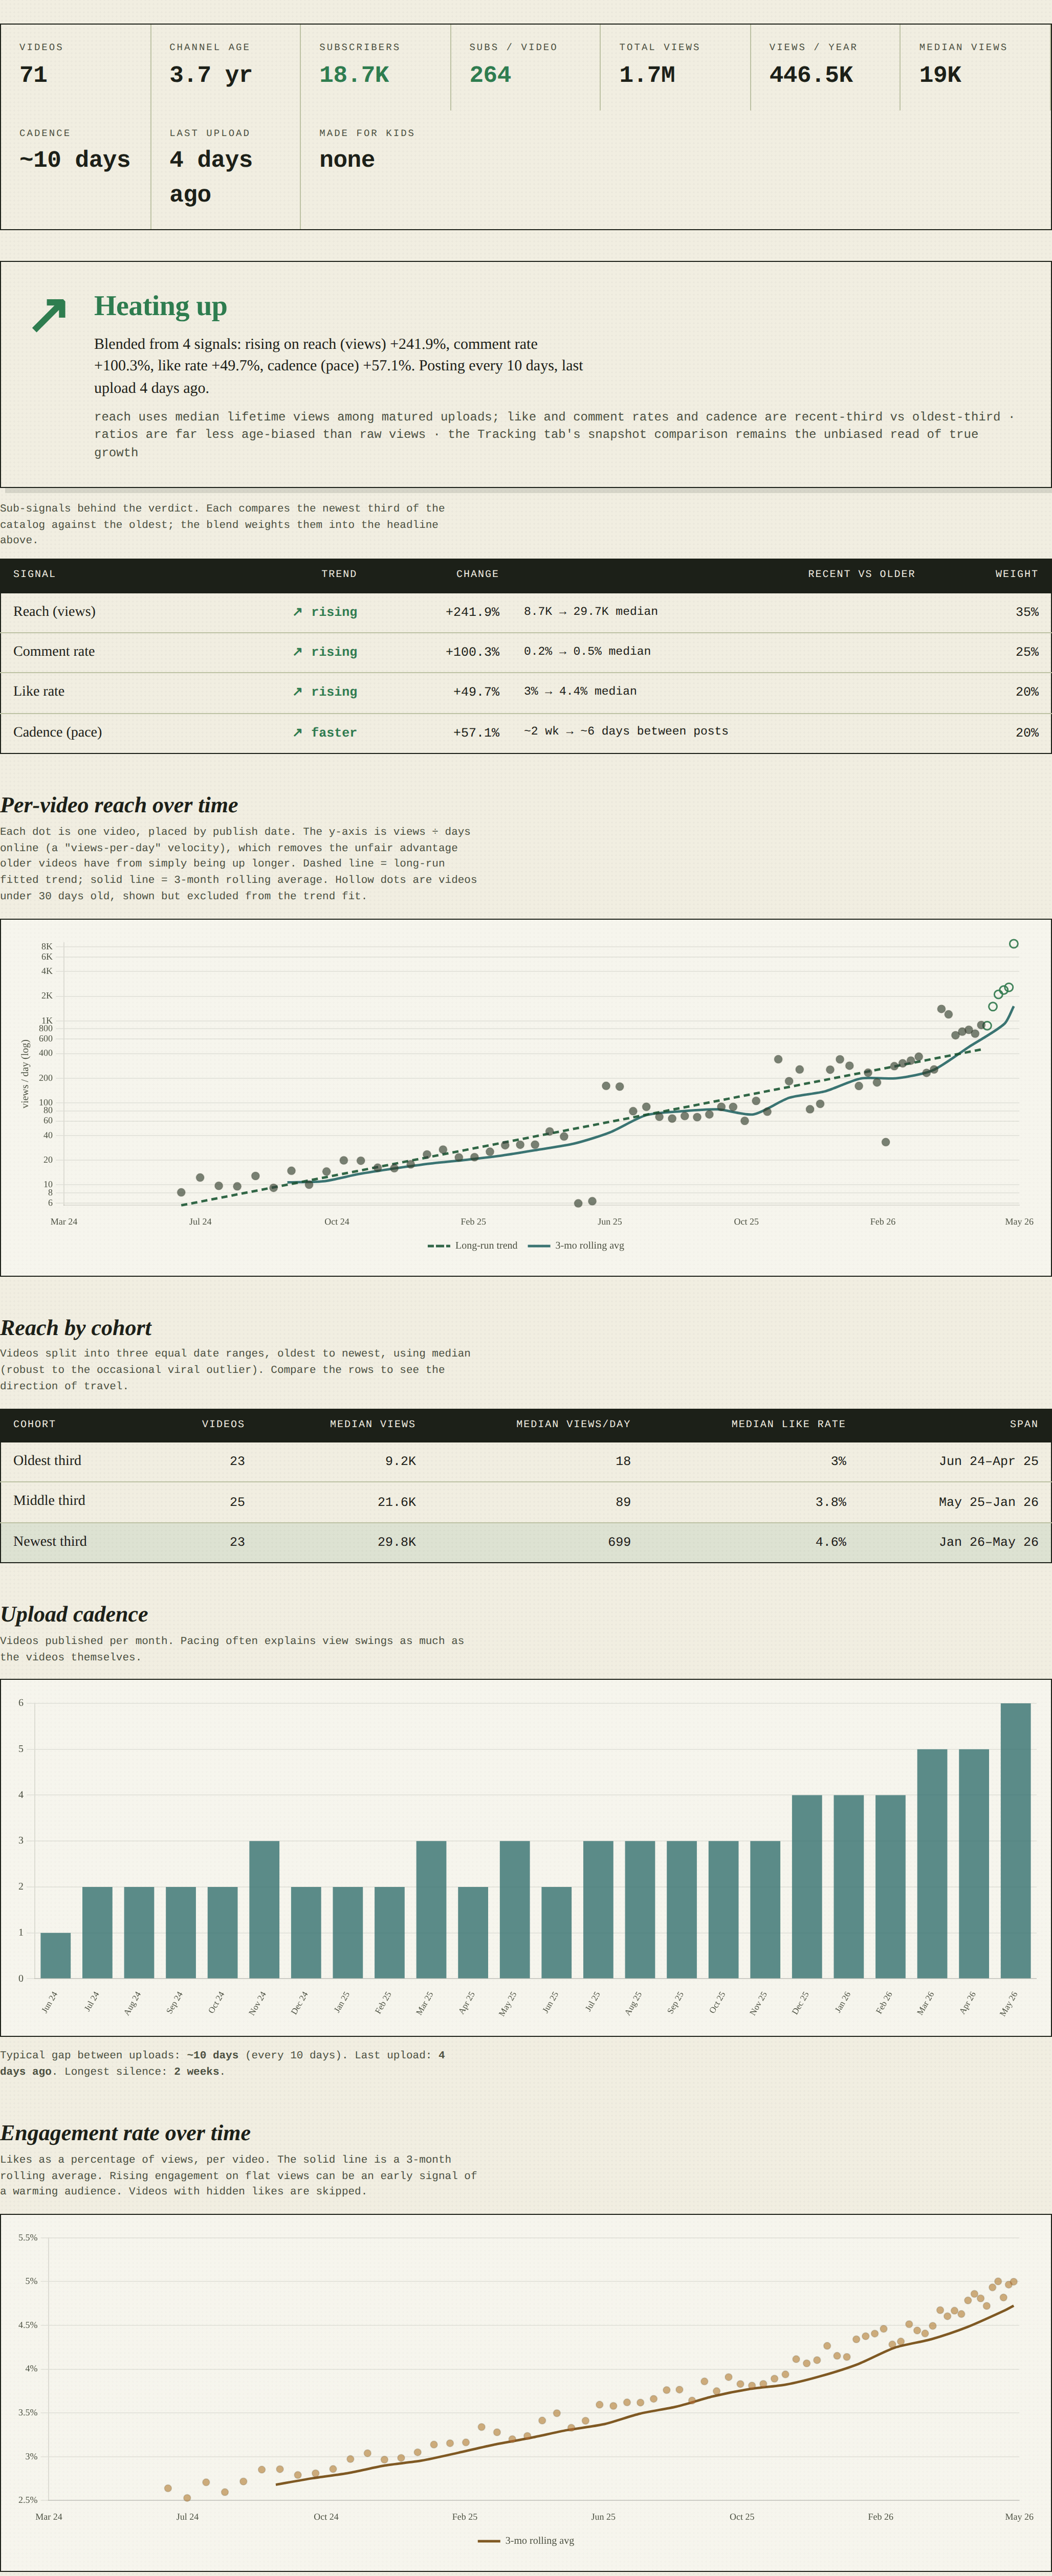
That headline at the top, Heating up, comes from a weighted blend of:
Reach. Median lifetime views of the newest third of the catalog versus the oldest third. Not views-per-day. Total views. Among videos at least 90 days old, so the steep-tail bias is mostly out of the system.
Comment rate and like rate. Engagement as a share of views, recent versus older. These are ratios, and ratios stabilize fast. A video’s like-rate is roughly settled within weeks while its view count keeps drifting forever. That makes them a much cleaner read of “is the audience getting more invested” than raw view counts.
Cadence. Whether the gap between uploads is shrinking or widening. Pure timestamps, completely age-independent, a perfect effort signal.
Each gets a direction. Each gets a weight. The blend produces the headline. The table beneath shows the work. A channel cooling on views but heating on engagement is right there, in plain sight. Not buried in a number.
The point of the sub-signals is that I do not want anyone, including me, to trust the headline blindly. If you are going to give a one-word verdict on someone’s creative output, you owe the reader the receipts.
The Bug That Taught Me the Most
There is one more layer in there worth talking about, because it is what made me trust the tool.
A channel can fake an “uptick” by pivoting to Shorts. Shorts pull big view counts, especially after YouTube changed how they count Shorts views in March 2025. So if a channel’s newest third is mostly Shorts and the oldest third is mostly standard uploads, the reach signal will read off the charts even though nothing real changed. The channel just changed format.
I tested this. I built a fake channel that did exactly that. Recent videos were all Shorts pulling 400,000 views each. Older videos were flat standard uploads. The old logic would have screamed “GAINING MOMENTUM.” The new logic detects the format shift, compares standard-uploads-only, finds the actual underlying trend was flat, and prints Stagnant. The little phrase next to the reach signal says “format mix shifted, so this compares standard uploads only.”
I cannot tell you how satisfying that was. Honest defeat of a confounding variable. That is craftsmanship.
What Else Is in There
Once you have pulled the catalog, you might as well look at everything.
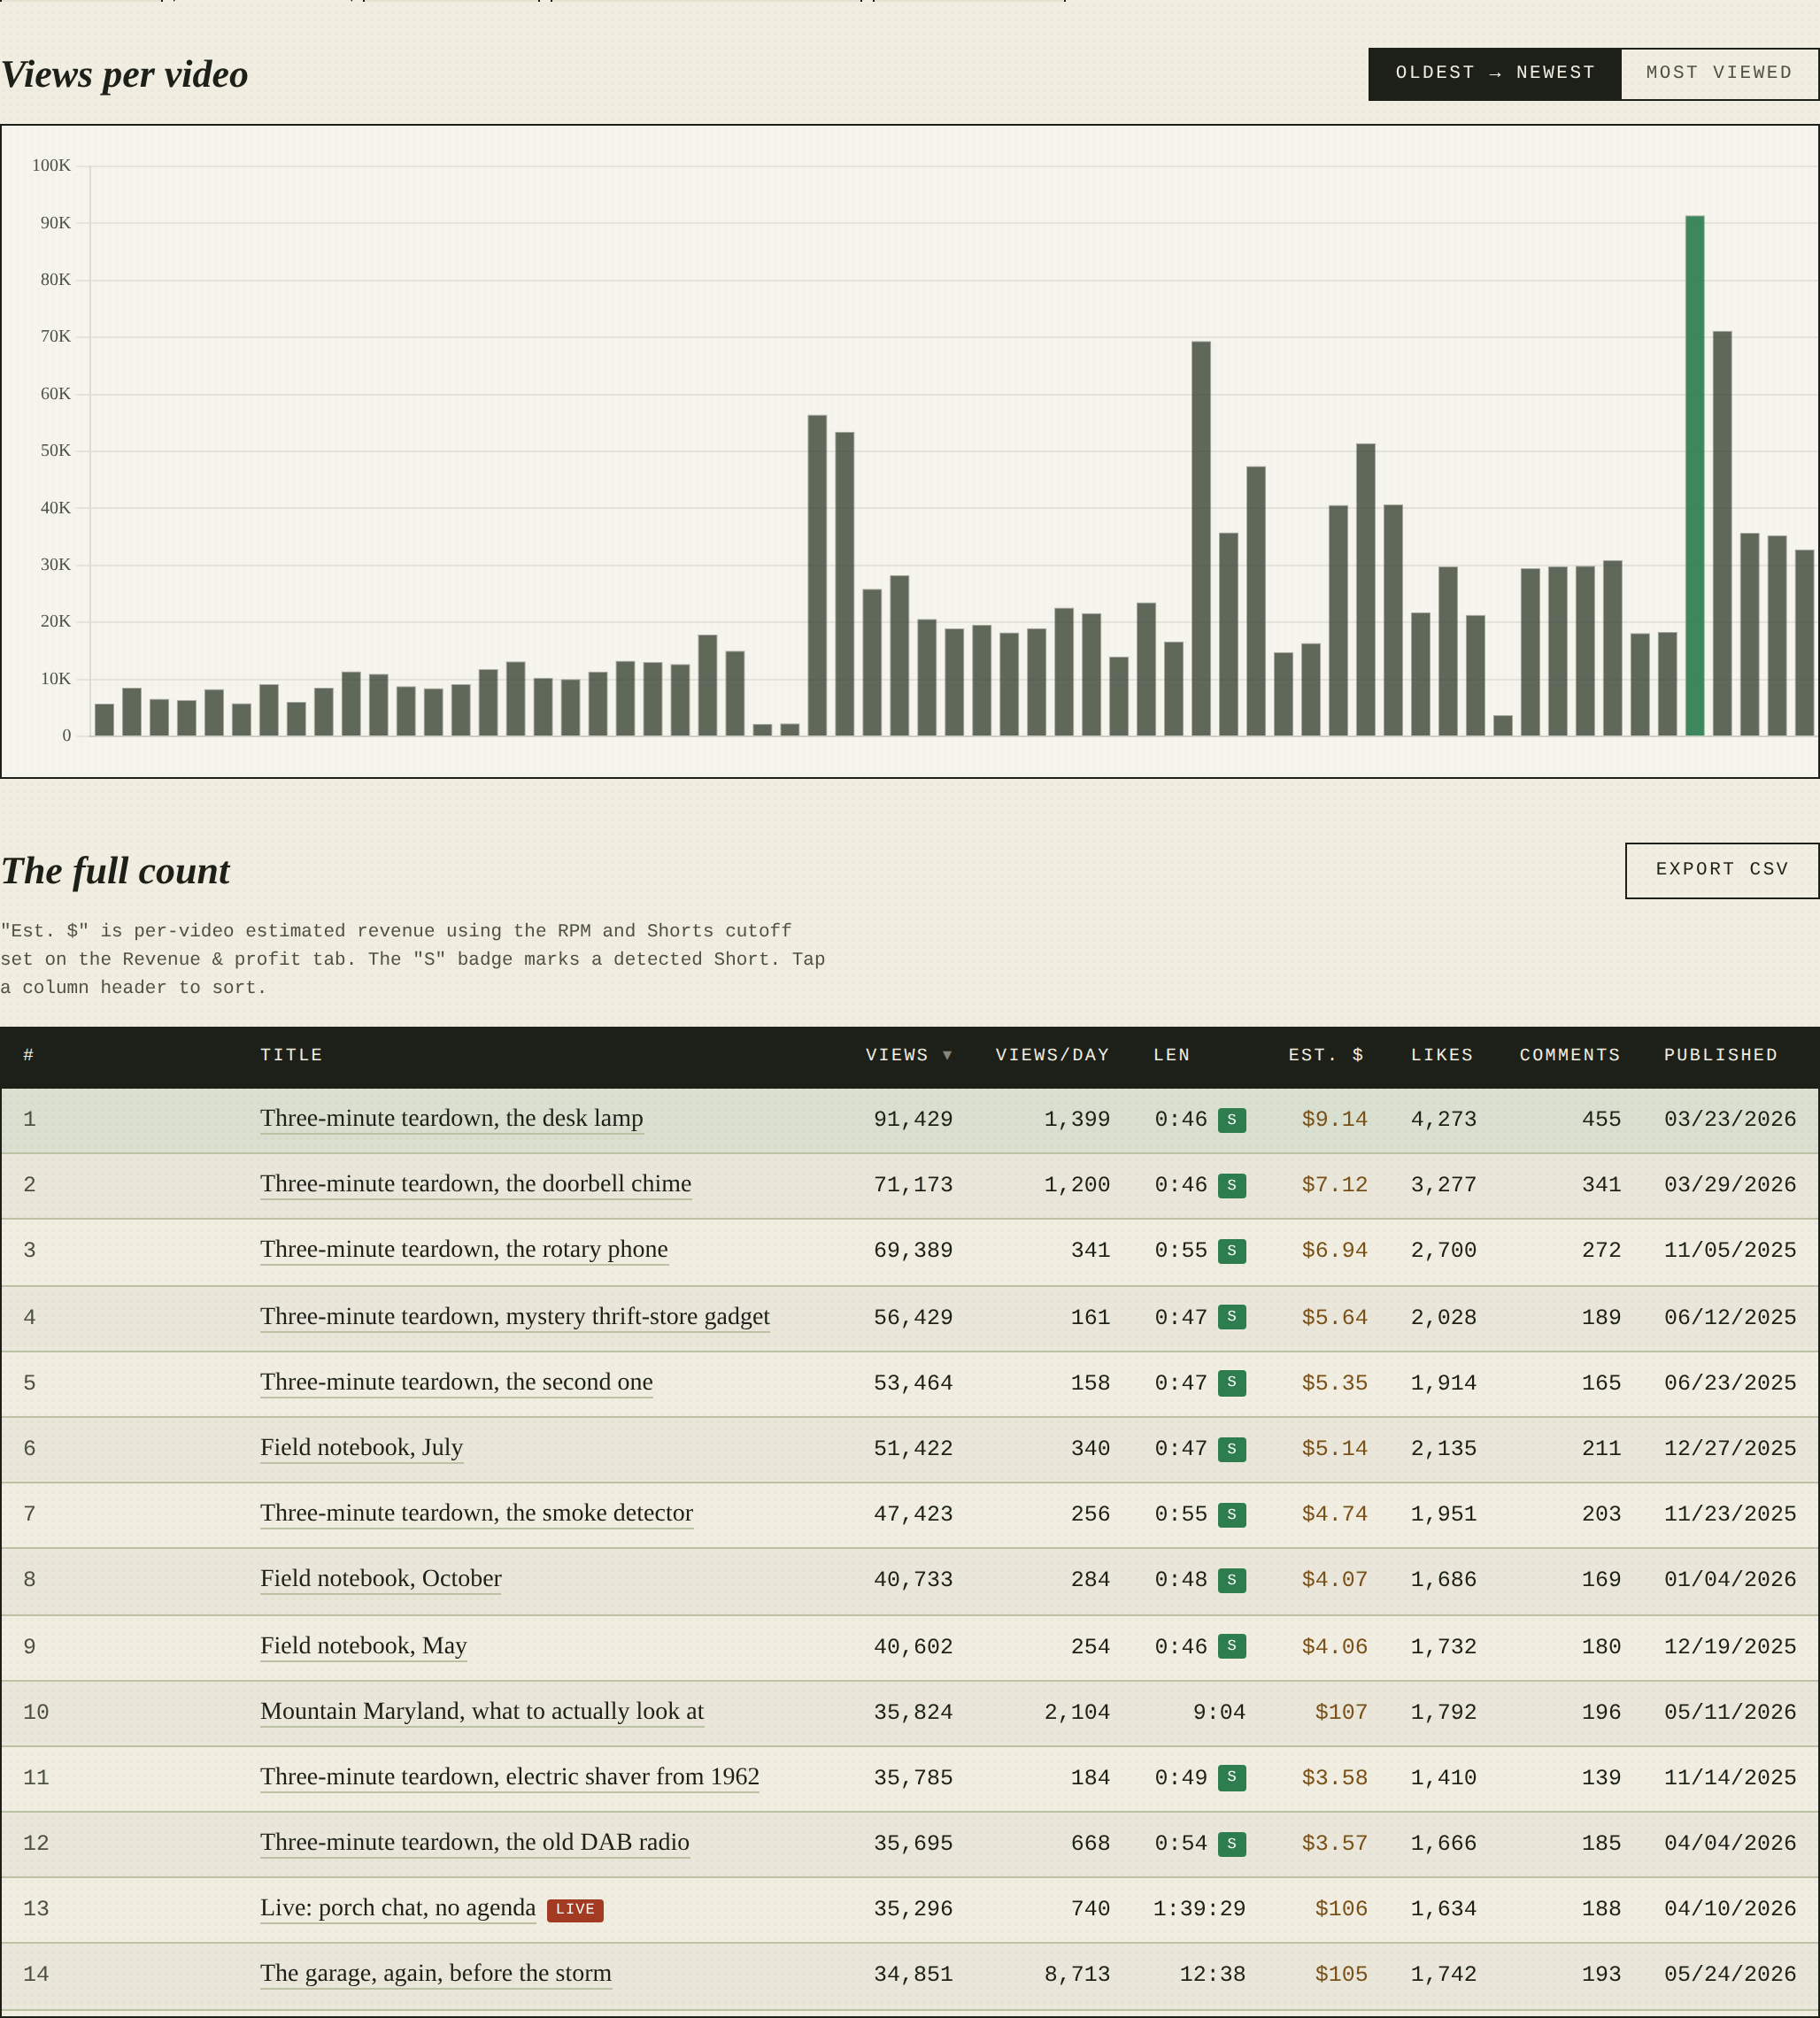
The catalog tab is a sortable table of every video. Views, views per day, length, estimated revenue, likes, comments, thumbnails, badges for Shorts and livestreams and made-for-kids and AI-flagged content. CSV export. The bar chart up top is a quick visual answer to “which videos worked.”
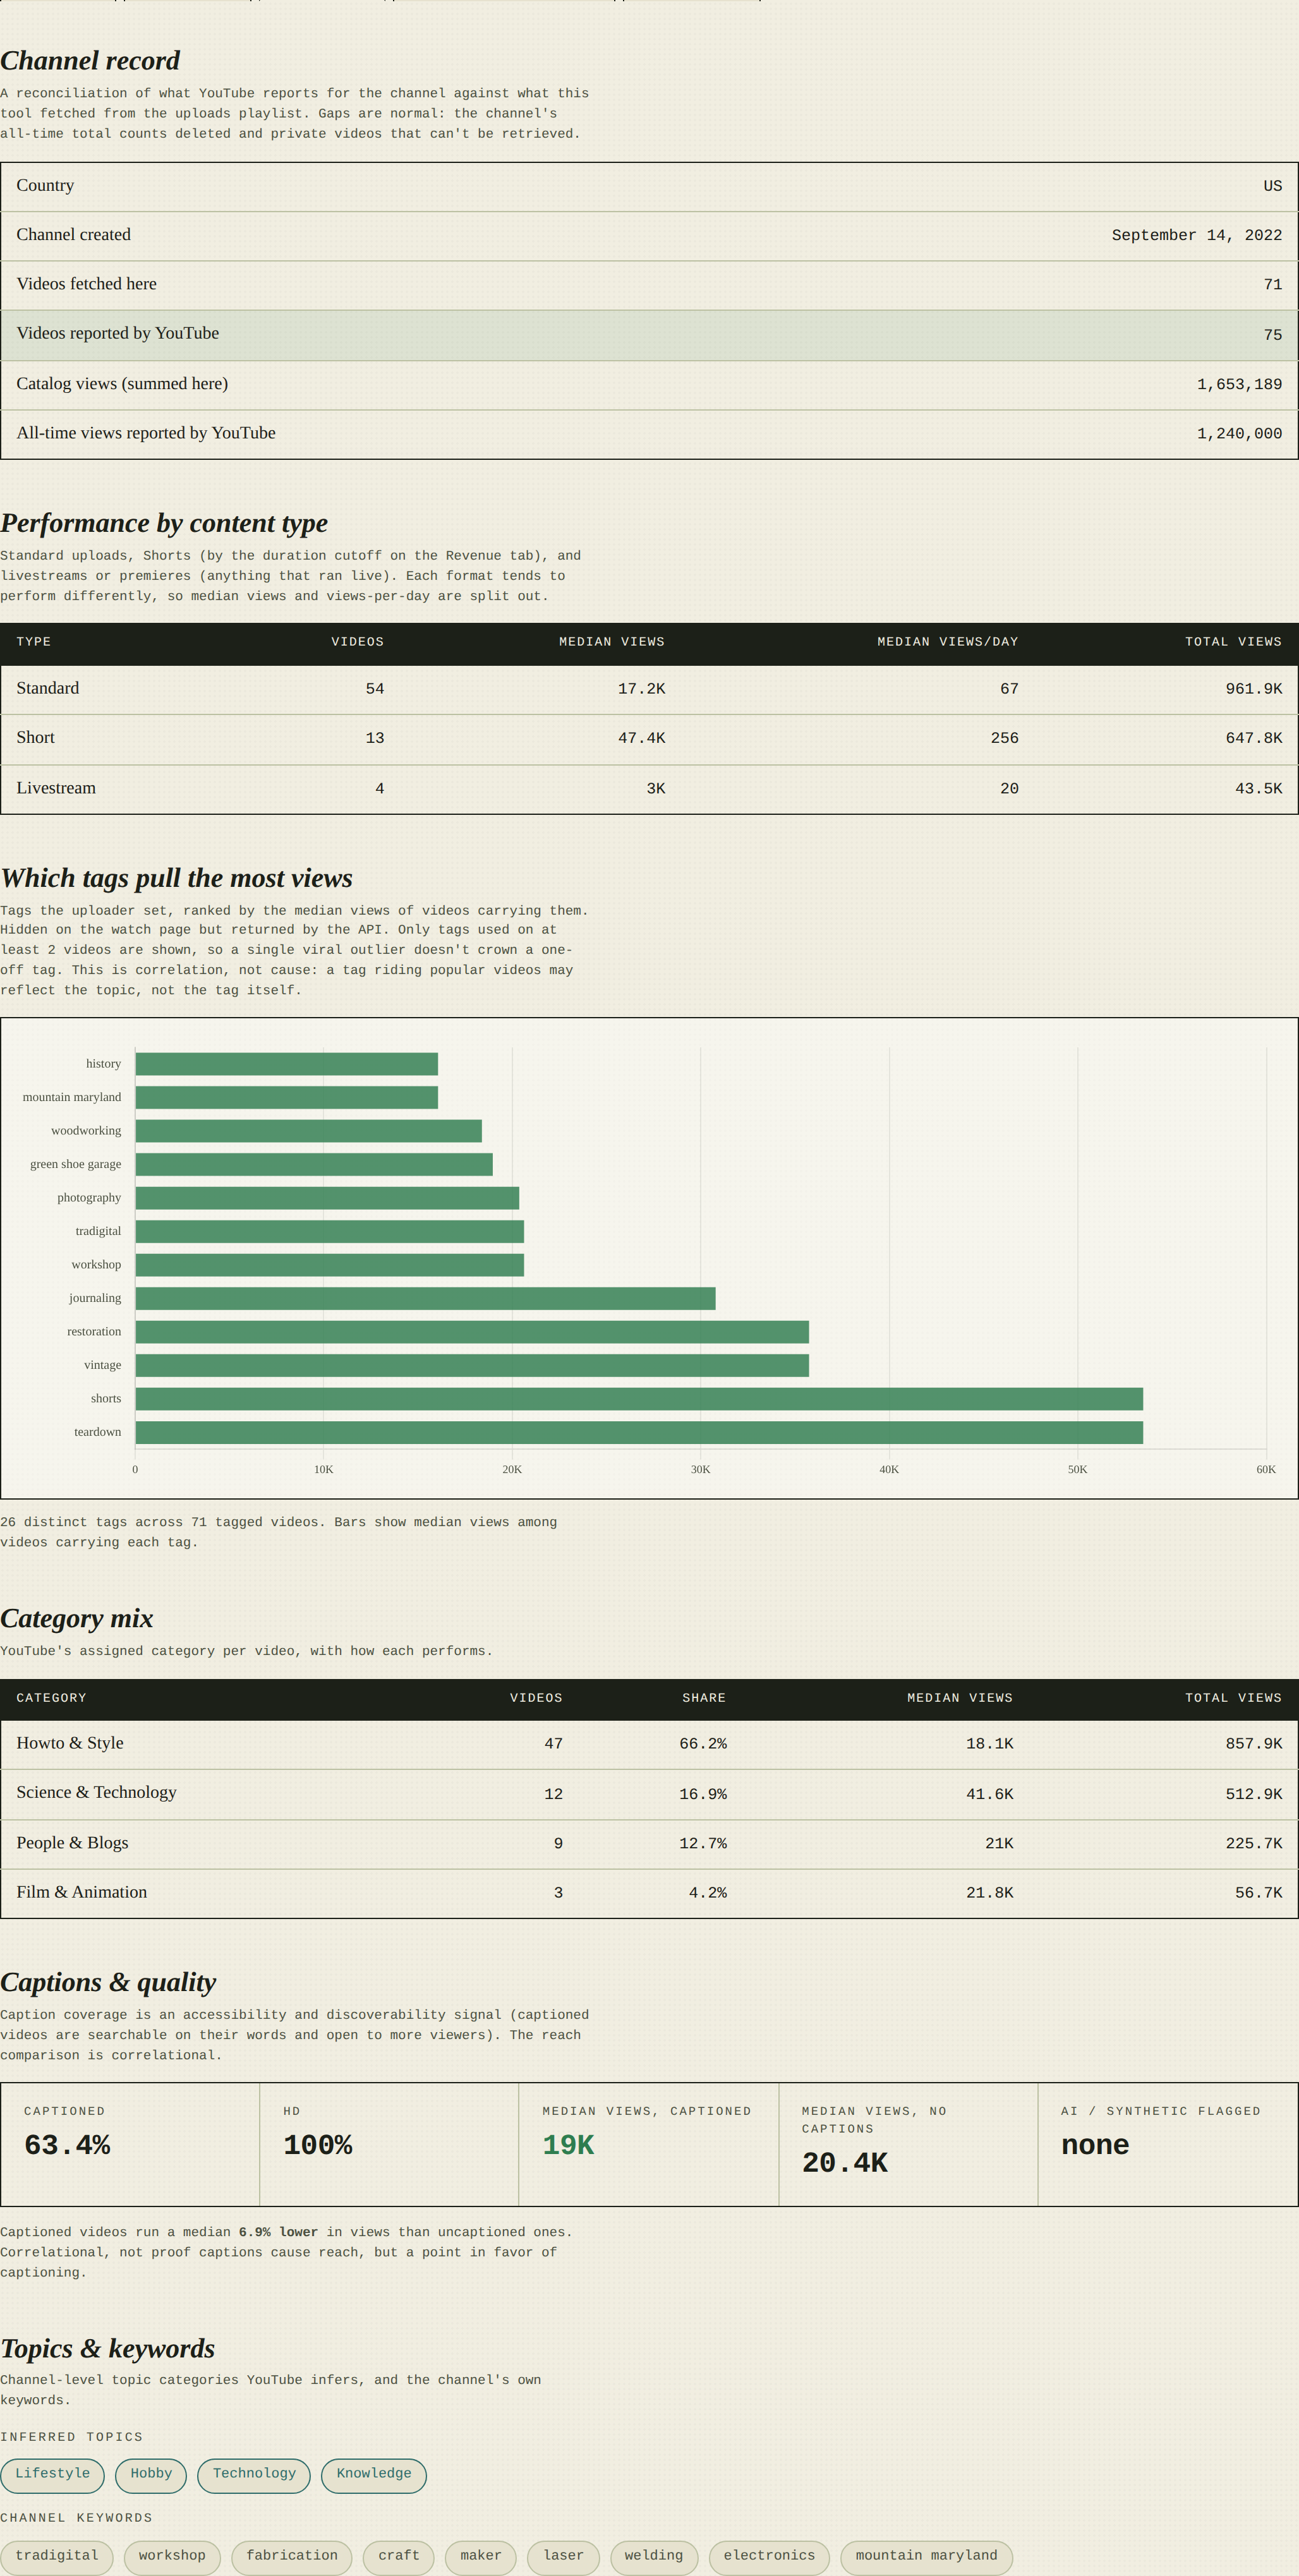
The content tab asks a different question. What is this channel made of, and what kind of content works for it. Performance by content type, broken into Standard, Shorts, and Livestreams (a Shorts pivot looks different here than in the verdict). The tags the uploader set, ranked by the median views of videos carrying them, which is a more honest read of “what works for you” than vanity tags. A category breakdown, a caption coverage rate compared against views (correlational, not causal, the tool says so out loud), and the channel’s own keywords as chips. There is also a small reconciliation table that shows what YouTube reports for the channel versus what the tool fetched, because deleted and private videos exist and the gap is honest information.
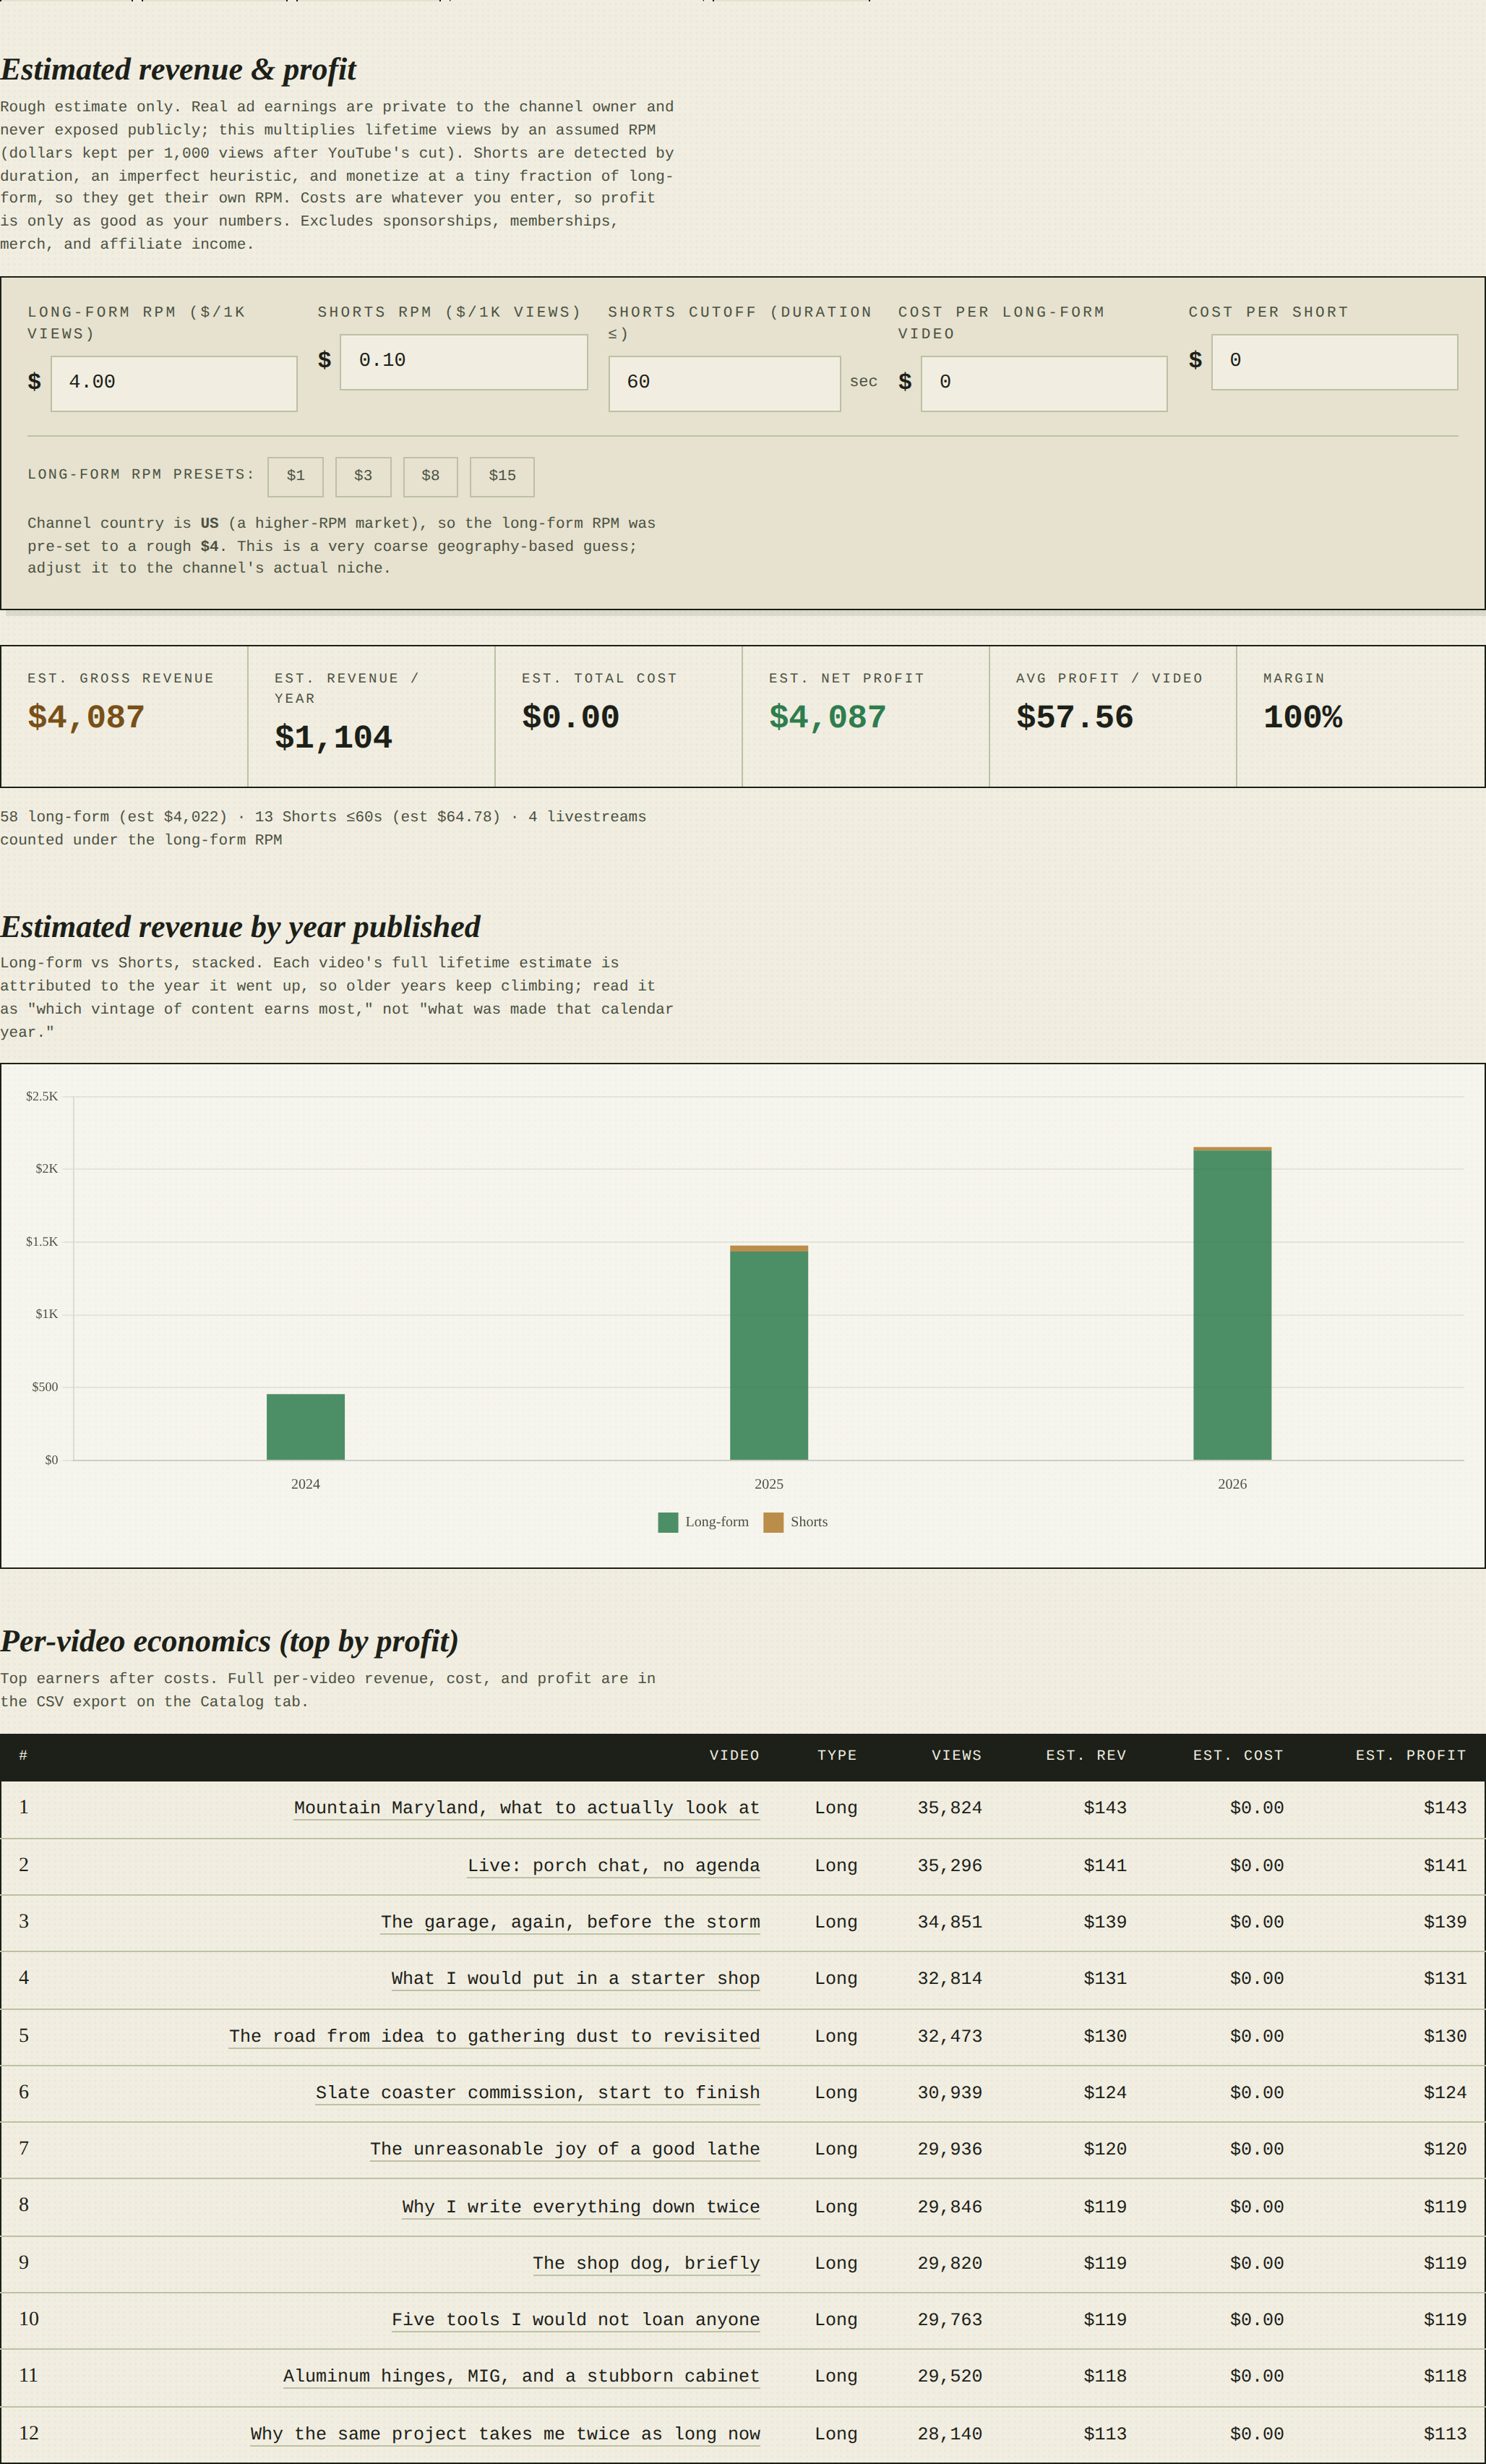
The revenue tab is the place I am most nervous about. Real ad earnings are private. The tool estimates, by multiplying views by an assumed RPM, and clearly labels it as a guess. Shorts get their own RPM (they monetize at a tiny fraction of long-form). Livestreams ride with long-form. The country the channel is in sets a coarse default. You can plug in a production cost per video and get a profit number. It is back-of-envelope, on purpose. But it is useful back-of-envelope, and I caveat it everywhere it appears.
The tracking tab is the only honest answer to “is this channel really growing.” A single pull cannot tell you, because YouTube only hands back lifetime totals as they stand right now. So the tool lets you save a snapshot today and load it back next month, after a fresh pull, to compute actual views gained, actual subscribers added, actual marginal subs per new video. Run it on a calendar and you build a real longitudinal record.
What I Got Wrong
A few things I want to be honest about.
The momentum verdict is still a single snapshot. The ratio signals carry a little age drift (older videos accumulate slightly different audiences than their first weeks). The blend weights are a judgment call, not science. I show the weights and the underlying numbers because I do not want the verdict to be a black box, but it is a verdict, not a measurement.
The revenue estimate is not your channel’s earnings. It is a rough multiplier. Real numbers live behind your login. The tool tells you this on the page.
Shorts detection is a duration heuristic. There is no “is a Short” flag in the API. YouTube allows Shorts up to about three minutes now, so the cutoff is adjustable.
A lot of the analyses are correlational. Captioned videos in this channel get a few percent more views than uncaptioned ones. The tool says so. It also says, in print, that this is not proof captions cause reach. They are just associated. That distinction matters.
Why I Made It This Way
I think there is a version of this tool that hides all that. That gives you a single confident number, a green or red arrow, and lets you feel smart. I am not interested in building that tool. It would not be useful and it would not be true.
The reason View Ledger has a verdict at all is so you have somewhere to start. The reason every signal is exposed underneath the verdict is so you can argue with it. The reason the limitations are printed on every tab is because I would rather you trust the tool a little less and use it a little more carefully.
I am of an age where I grew up taking things apart to see how they worked. That is still the right move. Use the tool. Click around. Pull a channel you know well and see if the verdict matches your gut. If it does not, look at the sub-signals and figure out which of you is wrong. Most of the time, in my experience, it has been me.
How to Try It
View Ledger is a single HTML file. The source is on GitHub. The license is GPL-3.0. You will need a free YouTube Data API key from Google Cloud Console (about two minutes), and you will need a browser. That is the entire stack.
Pick a channel that interests you. Pull it. Save a snapshot. Come back next month. That is when the tool earns its keep.
If you build something with it, or find a bug, or have an idea for what to add, I want to hear about it.
The next thing I am thinking about is whether to let the snapshot history hold more than two points, so you can chart real growth across many pulls. That feels like the right next move. But I want to use the current version for a few months first, on real channels, and see what I learn before I add more knobs.
That, more than anything, is the lesson of this build. Make the smallest honest thing. Use it. Then let what you learn shape what comes next.