
How to Send Arduino Sensor Data to Google Sheets with Zoho Flow
No Backend Required!


TL;DR: GitHub repo containing the example code is here.
Imagine you're tinkering with an Arduino in your workshop. You’ve hooked up a temperature sensor, maybe a light sensor too, and the readings are flowing in smoothly through the serial monitor. It's fun… but what if you could log that data in real-time to a Google Sheet, accessible from anywhere, sharable with your team, or viewable from your phone?
That’s the power of combining the Arduino Uno R4 WiFi with Zoho Flow — and it's easier than you think.
Traditionally, sending sensor data to the cloud meant building some kind of server or investing in expensive cloud platforms. That's overkill for many projects, and honestly, it’s a buzzkill when all you want is to see your sensor data neatly flowing into a spreadsheet.
Enter Zoho Flow, a low-code integration platform that acts like Zapier's savvy cousin. With just a webhook, you can have your Arduino send data to Zoho Flow, which then pipes it right into Google Sheets. No servers, no authentication headaches, no Firebase config files. The negative being if someone got your Zoho API Key and learned the message format, they could spike your spreadsheet with bogus data.
What You’ll Need
Arduino Uno R4 WiFi
An analog sensor (e.g., LDR, TMP36, etc.) connected to A0
Wi-Fi access
A free Zoho account and access to Zoho Flow
A Google Sheet you want to log data into
Step-by-Step: Sensor to Spreadsheet
1. Set Up Your Google Sheet
Create a new Google Sheet with columns like:
Timestamp | Arduino | Sensor | Value
Use Google Sheets' built-in timestamping if you want, or add it in Zoho Flow. In this example, we get the timestamp from Zoho.
IMPORTANT: Add the column headers before creating the flow in Zoho, else you will not see the field names once you start linking to the spreadsheet.
Also, grab the spreadsheet ID number from the address bar in the browser. It’s all the random numbers and letters between the /d/ and/edit?. We will need that in Zoho Flow.

Figure 1. The spreadsheet with column headers and data starting to flow in.
2. Create a Zoho Flow
Go to Zoho Flow.
Create a new flow and choose "Webhook" as the trigger.
Copy the Webhook URL.
Add an action: Google Sheets → Create Row.
Map the webhook field (e.g.,
value) to your Sheet’s columns.

Figure 2. Configuring the Zoho Flow Webhook. Be sure to grab the zapikey. It’s all the numbers and letters after /?zapikey= AND before &isdebug=false
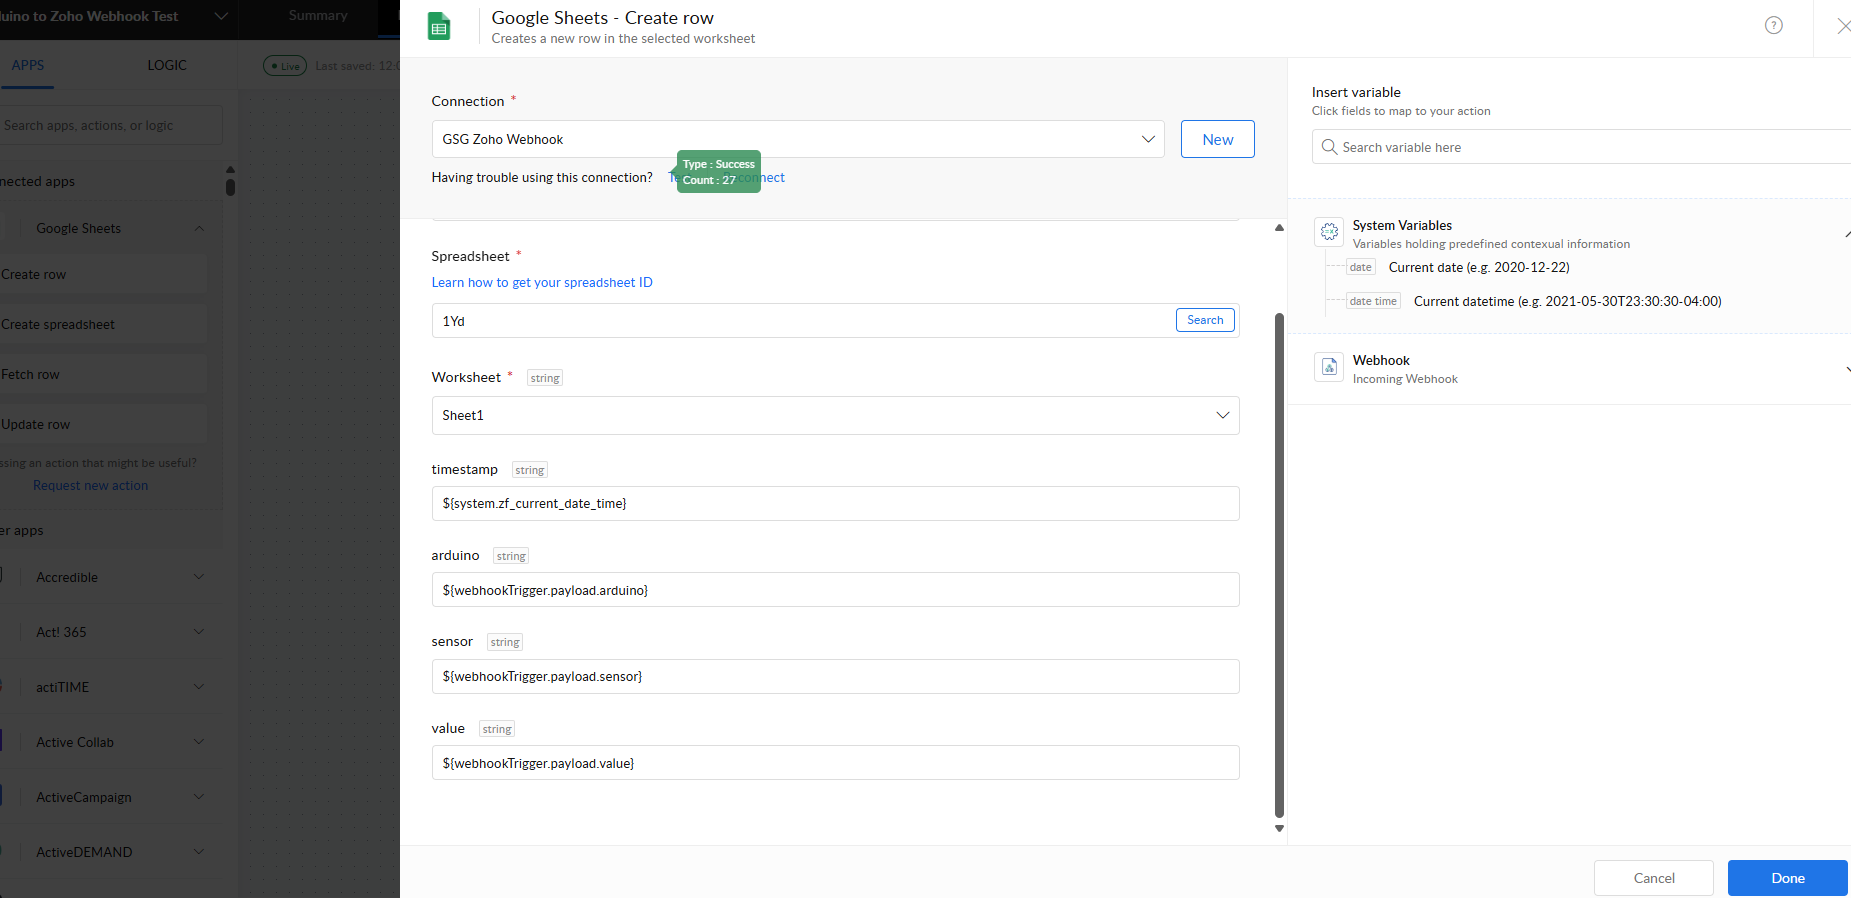
Figure 3. Configuring the Sheet action. Don’t forget you need the Google Sheets ID for the spreadsheet that will be logging the data.

Figure 4. Once configured, you can turn the Zoho Flow on and off as needed.

Figure 4. Zoho Flow provides analytics. Useful to see if your Flow is having any issues.
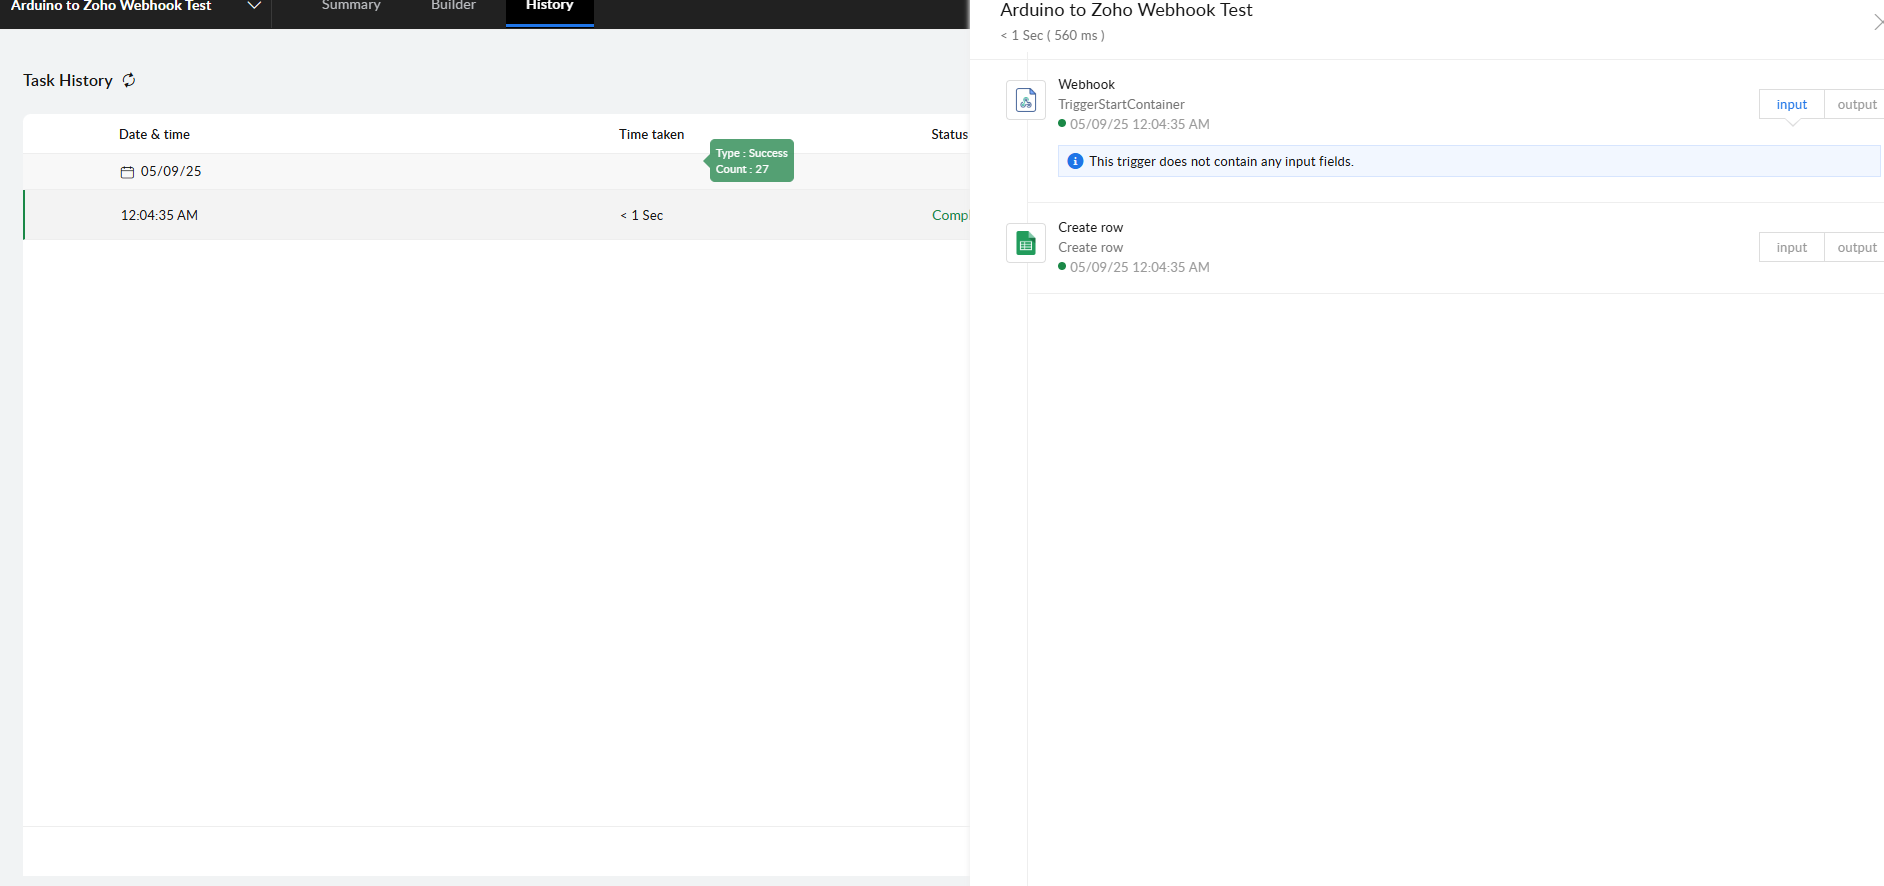
Figure 5. Zoho Flow also provides an history of the triggers and actions of your flow.
3. Code Your Arduino
Upload this code to your Arduino Uno R4 WiFi:
/*
  Arduino to Google Sheets via Zoho Webhook
 */


#include "WiFiS3.h"
#include "arduino_secrets.h"

///////please enter your sensitive data in the Secret tab/arduino_secrets.h
char ssid[] = SECRET_SSID;        // your network SSID (name)
char pass[] = SECRET_PASS;    // your network password (use for WPA, or use as key for WEP)
char zapikey[] = ZOHO_KEY;
int keyIndex = 0;            // your network key index number (needed only for WEP)

int status = WL_IDLE_STATUS;

char server[] = "flow.zoho.com";

// Initialize the Ethernet client library
// with the IP address and port of the server
// that you want to connect to (port 80 is default for HTTP):
WiFiSSLClient client;

/* ---------------------------------------------------------- */
void setup() {
/* ---------------------------------------------------------- */
  //Initialize serial and wait for port to open:
  Serial.begin(9600);
  while (!Serial) {
    ; // wait for serial port to connect. Needed for native USB port only
  }

  // check for the WiFi module:
  if (WiFi.status() == WL_NO_MODULE) {
    Serial.println("Communication with WiFi module failed!");
    // don't continue
    while (true);
  }

  String fv = WiFi.firmwareVersion();
  if (fv < WIFI_FIRMWARE_LATEST_VERSION) {
    Serial.println("Please upgrade the firmware");
  }

  // attempt to connect to WiFi network:
  while (status != WL_CONNECTED) {
    Serial.print("Attempting to connect to SSID: ");
    Serial.println(ssid);
    // Connect to WPA/WPA2 network. Change this line if using open or WEP network:
    status = WiFi.begin(ssid, pass);

    // wait 10 seconds for connection:
    delay(10000);
  }

  printWifiStatus();
}


void send_data() {
  int sensor_reading = analogRead(A0);
  Serial.print("Sensor Value: ");
  Serial.println(sensor_reading);
  Serial.print("Starting connection to server...");
  if (client.connect(server, 443)) {
    Serial.println("connected to server.");
    // Make a HTTP request:
    String postData = "GET /731846675/flow/webhook/incoming?zapikey=" + String(zapikey) + "&isdebug=false&arduino=unoR4&sensor=temperature&value=" + String(sensor_reading) + " HTTP/1.1";
    client.println(postData);
    Serial.println(postData);
    Serial.println();
    client.println("Host: flow.zoho.com");
    client.println("Connection: close");
    client.println();
  }

}


/* just wrap the received data up to 80 columns in the serial print*/
/* --------------------------------------------------------------- */
void read_response() {
/* --------------------------------------------------------------- */
  uint32_t received_data_num = 0;
  while (client.available()) {
    /* actual data reception */
    char c = client.read();
    /* print data to serial port */
    Serial.print(c);
    /* wrap data to 80 columns*/
    received_data_num++;
    if(received_data_num % 80 == 0) {
      Serial.println();
    }
  }
}

/* -------------------------------------------------------------- */
void loop() {
/* -------------------------------------------------------------- */
  send_data();
  read_response();

  // if the server's disconnected, stop the client:
  if (!client.connected()) {
    Serial.println();
    Serial.println("disconnecting from server.");
    client.stop();
  }

  delay(30000);
}

/* --------------------------------------------------------------- */
void printWifiStatus() {
/* --------------------------------------------------------------- */
  // print the SSID of the network you're attached to:
  Serial.print("SSID: ");
  Serial.println(WiFi.SSID());

  // print your board's IP address:
  IPAddress ip = WiFi.localIP();
  Serial.print("IP Address: ");
  Serial.println(ip);

  // print the received signal strength:
  long rssi = WiFi.RSSI();
  Serial.print("signal strength (RSSI):");
  Serial.print(rssi);
  Serial.println(" dBm");
}
And for secrets.h the file will look like this:
#define SECRET_SSID "YOUR-NETWORK-SSID-HERE"
#define SECRET_PASS "YOUR-NETWORK-PASSWORD-HERE"
#define ZOHO_KEY    "YOUR-KEY-HERE"
Be sure to replace the words between the ““ with your actual SSID, password, and API key.
4. Watch the Magic Happen
Run your sketch, open your Google Sheet — and watch as your sensor values appear in real-time. Boom! You're now logging physical world data to the cloud with no backend and almost no code.
Why This Matters
This setup is more than a one-off trick. It’s a pattern — a modular way to build IoT systems without needing to be a full-stack developer. You can now:
Log plant soil moisture from your garden
Track light levels in a photo lab
Monitor temperature in a server closet
…or build a full dashboard using Zoho Analytics or Google Data Studio
It scales with your ambition.
Take It Further
Add timestamping in Arduino or Zoho Flow
Use multiple sensors and send multiple fields
Display values on an OLED screen and log them simultaneously
Schedule email alerts or SMS if values go out of range — all from Zoho Flow!
Final Thoughts
If you're an engineer, maker, or educator dreaming of low-friction IoT logging, this combo — Arduino Uno R4 WiFi + Zoho Flow + Google Sheets — is a dream team.
No backend. No cloud headaches. Just data from the real world, flowing into your spreadsheet like magic.
So what are you waiting for?
Grab a sensor, spin up a Zoho Flow, and build your first cloud-connected data logger this weekend. You’ll be amazed at what you can build with just a few wires and a good webhook.
UPDATE: Since the data is sitting in Google Sheets, you can also use Google Looker Studio to visualize the data and then embed it on your website. See below:

Figure 6. Visualize the data using Google’s Looker Studio.
https://lookerstudio.google.com/embed/reporting/c708bc23-c096-4bb1-bbf9-22a1f172d7fe/page/kZuKF